Percentages
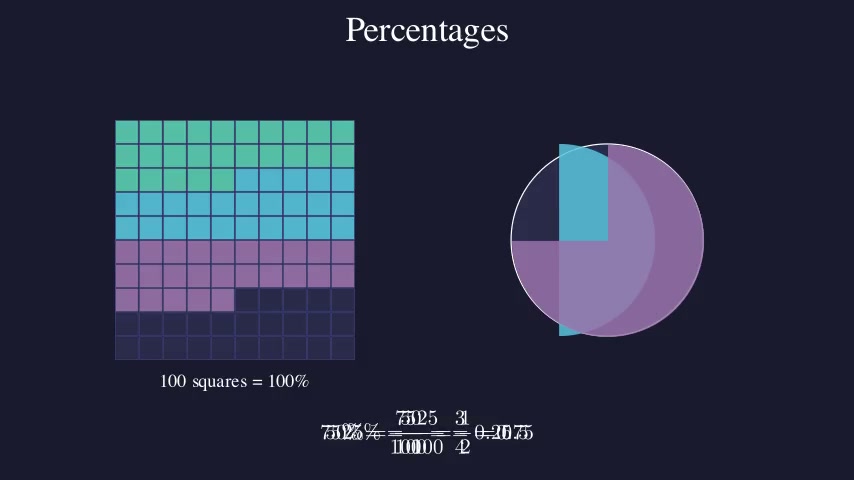
Builds understanding of percentages by shading a 10×10 grid and connecting it to fractions and decimals. A real-world discount example (20% off $50) anchors the concept in everyday math.
Duyệt các ví dụ hoạt ảnh Statistics được tuyển chọn trong Math, bao gồm các cảnh Manim có thể tái sử dụng, chứng minh trực quan và ý tưởng sẵn sàng để giảng dạy.
Math · 3 hoạt ảnh
Builds understanding of percentages by shading a 10×10 grid and connecting it to fractions and decimals. A real-world discount example (20% off $50) anchors the concept in everyday math.
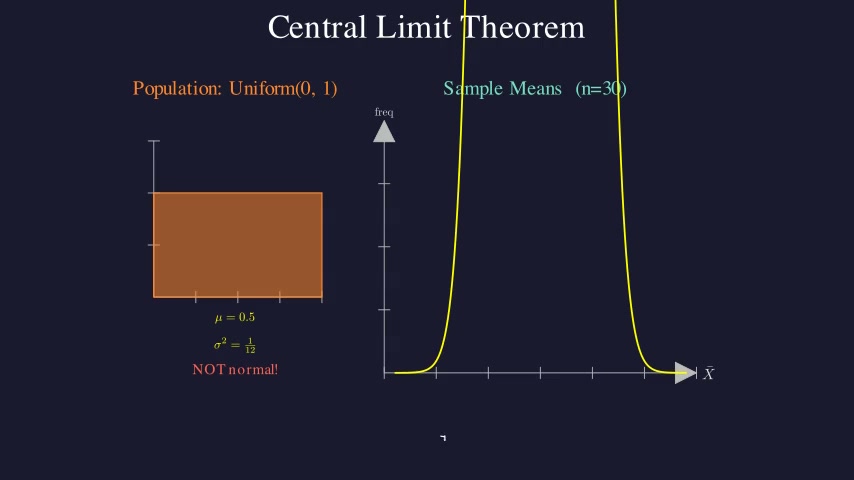
Demonstrates the Central Limit Theorem by starting with a non-normal (uniform) population, then repeatedly drawing samples of size n=30 and computing their means. As more sample means are collected, the histogram of means converges to a bell curve regardless of the original distribution's shape.
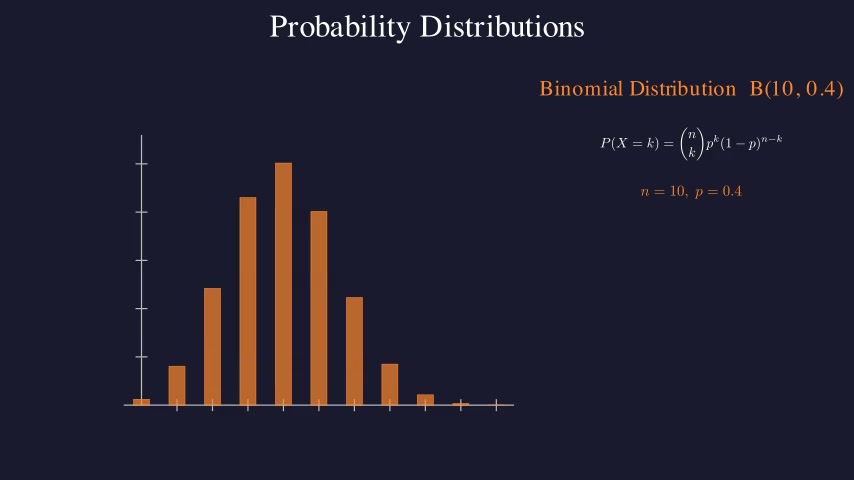
Introduces three fundamental probability distributions — Normal, Binomial, and Poisson — with visual representations and key formulas. For the Normal distribution, the 68-95-99.7 empirical rule is animated by progressively shading regions under the bell curve.