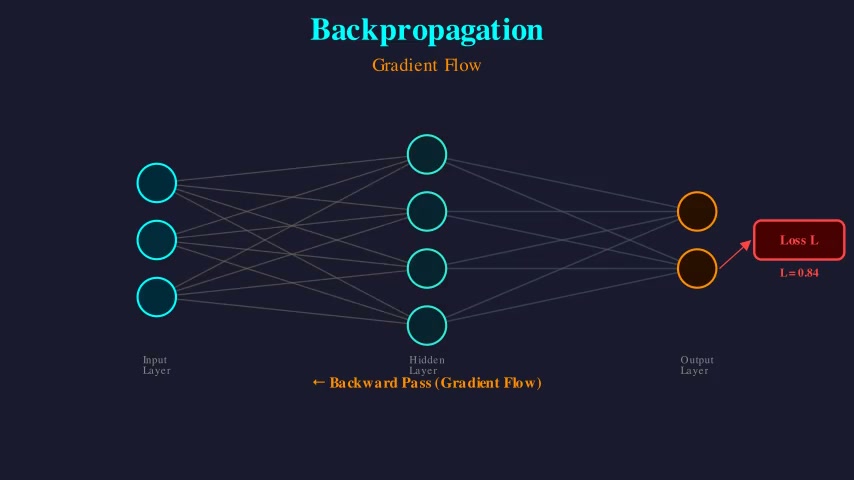
Backpropagation — Gradient Flow
Demonstrates backpropagation in a 3-layer neural network. A forward pass first computes activations left to right, then a loss is computed. Gradients flow backward through the network as a glowing wave, with the chain rule applied at each layer. The key partial derivative formula is displayed.