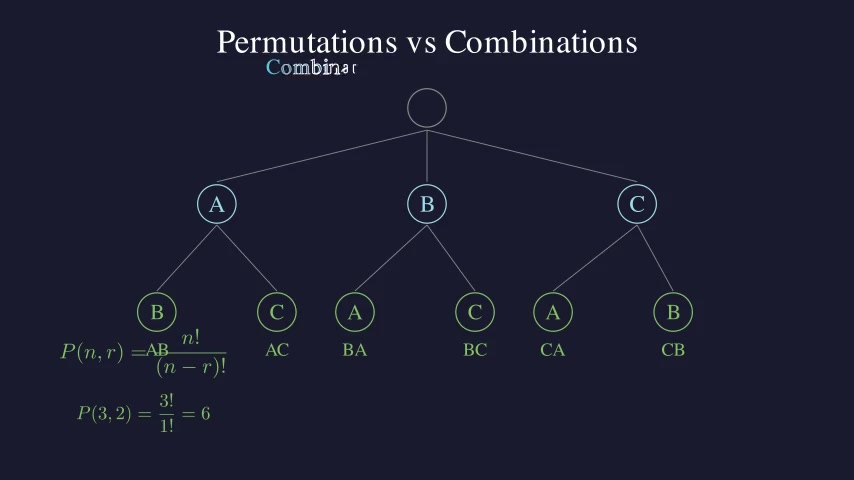
Permutations vs Combinations
This animation contrasts permutations (order matters) with combinations (order doesn't matter) using a concrete example of choosing 2 items from {A, B, C}. A tree diagram visually enumerates all 6 permutations, then groups are collapsed to show only 3 combinations, making the divide-by-r! factor intuitive.