Percentages
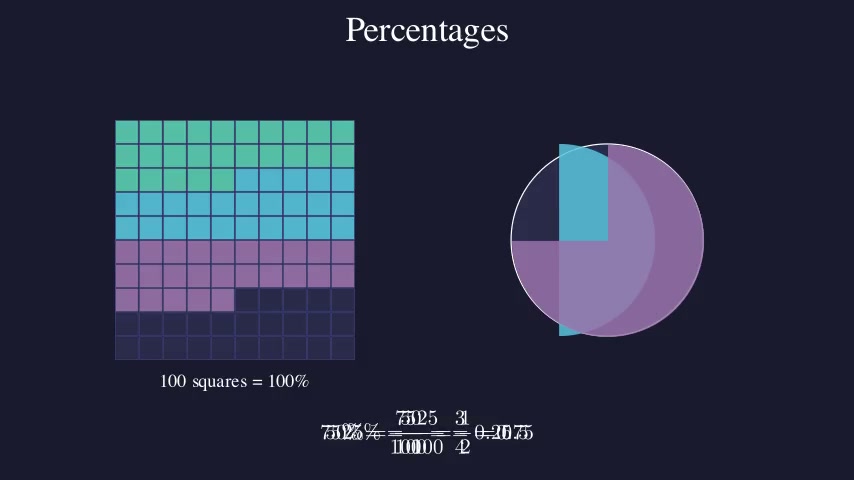
Builds understanding of percentages by shading a 10×10 grid and connecting it to fractions and decimals. A real-world discount example (20% off $50) anchors the concept in everyday math.
Parcourez des exemples d'animations Statistics sélectionnés dans Math, avec des scènes Manim réutilisables, des preuves visuelles et des idées prêtes à enseigner.
Math · 3 animations
Builds understanding of percentages by shading a 10×10 grid and connecting it to fractions and decimals. A real-world discount example (20% off $50) anchors the concept in everyday math.
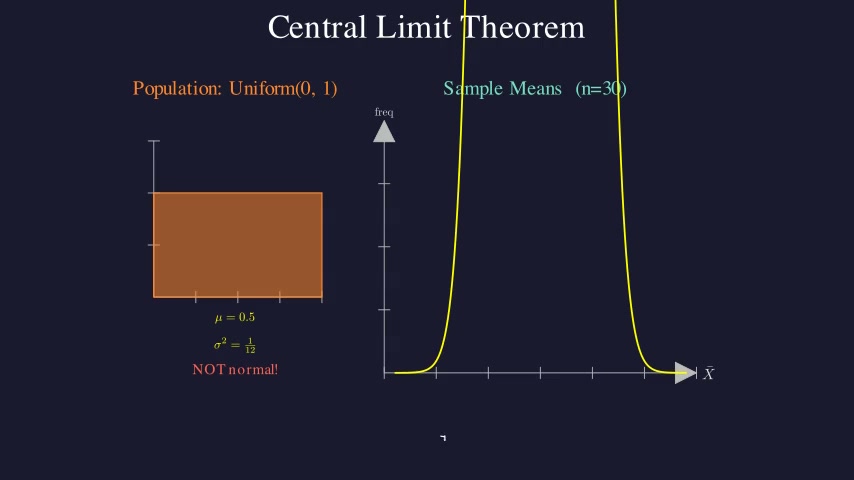
Demonstrates the Central Limit Theorem by starting with a non-normal (uniform) population, then repeatedly drawing samples of size n=30 and computing their means. As more sample means are collected, the histogram of means converges to a bell curve regardless of the original distribution's shape.
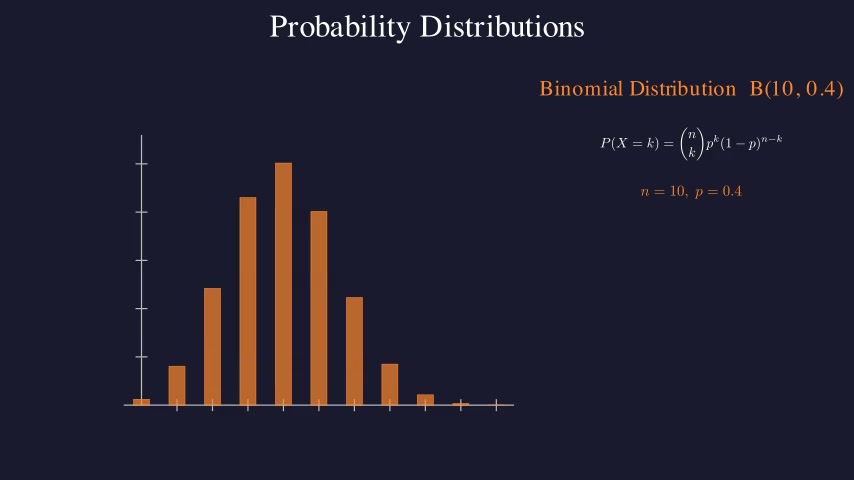
Introduces three fundamental probability distributions — Normal, Binomial, and Poisson — with visual representations and key formulas. For the Normal distribution, the 68-95-99.7 empirical rule is animated by progressively shading regions under the bell curve.