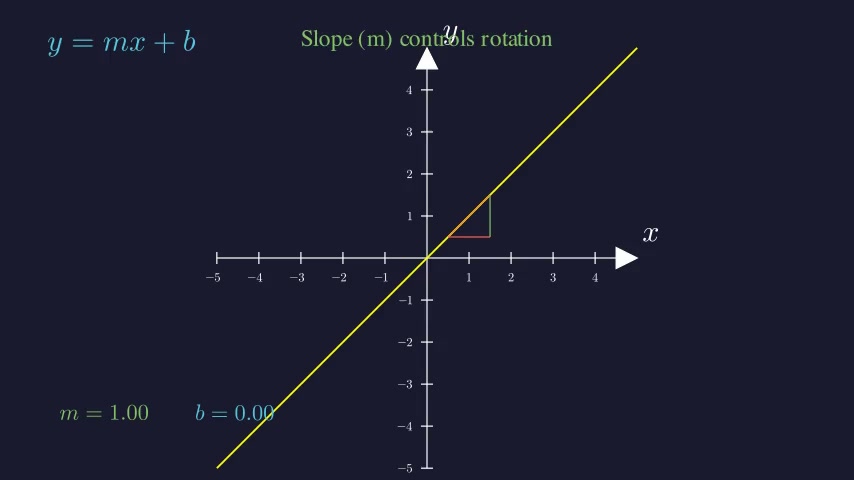
Linear Functions: Slope & Y-Intercept
This animation introduces linear functions of the form y = mx + b by visually demonstrating how the slope (m) and y-intercept (b) affect the graph. A line rotates as the slope changes from -2 to 2, then shifts vertically as the intercept changes from -3 to 3. A rise/run right-triangle indicator reinforces the geometric meaning of slope.