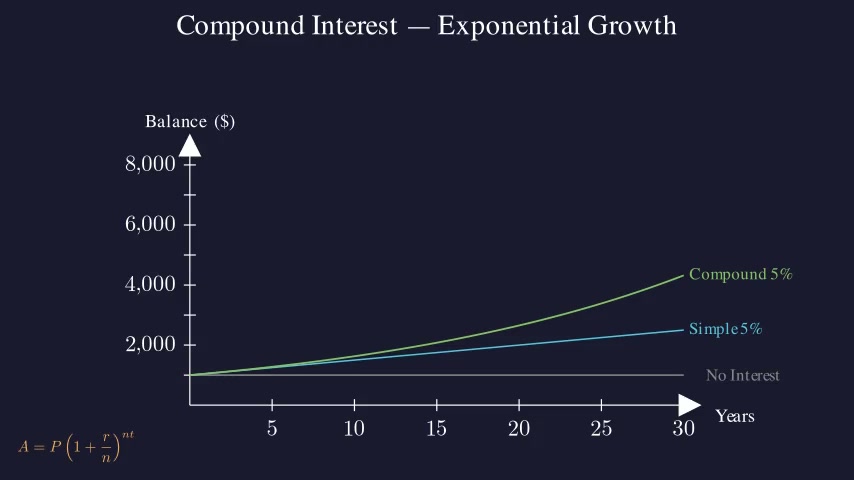
AnimG LogoAnimG

Economics animation videos

Browse curated Economics animation examples with reusable Manim scenes, visual explanations, and teaching-ready ideas.

6 animations

Compound Interest β€” Exponential Growth

Compound Interest β€” Exponential Growth

Demonstrates the power of compound interest by comparing three growth scenarios over 30 years: no interest (flat), simple interest at 5% (linear), and compound interest at 5% (exponential). Illustrates the compounding formula and a concrete $1000 @ 7% example showing $7,612 after 30 years.

Inflation β€” Purchasing Power Over Time

Inflation β€” Purchasing Power Over Time

Illustrates how inflation erodes purchasing power over time through multiple visual metaphors: a shrinking coin, a bar chart showing how many goods $100 buys across decades, the rising CPI index, and the Rule of 72 applied to purchasing power halving at 3% annual inflation (~24 years).

Supply & Demand Curves

Supply & Demand Curves

Visualizes how supply and demand curves interact to form a market equilibrium. Demonstrates the effects of a demand shift (rightward) and a supply shift (leftward) on equilibrium price and quantity, building core microeconomics intuition.

Game Theory β€” Prisoner's Dilemma

Game Theory β€” Prisoner's Dilemma

Introduces the Prisoner's Dilemma, a foundational concept in game theory. Shows a 2x2 payoff matrix, animates two prisoners making independent decisions, explains why (Defect, Defect) is the Nash Equilibrium even though mutual cooperation is Pareto superior. Highlights dominant strategies and the Nash Equilibrium condition.

Network Effects β€” Metcalfe's Law

Network Effects β€” Metcalfe's Law

Demonstrates network effects by visually building a graph of nodes and edges as users are added one by one. Shows that connections grow quadratically as n(n-1)/2, contrasting linear cost of new users with the quadratic growth in network value (Metcalfe's Law: V ∝ n²). Includes real-world examples like telephone networks and social media.

Option Pricing β€” Black-Scholes

Option Pricing β€” Black-Scholes

Visualizes the Black-Scholes option pricing model through three key concepts: geometric Brownian motion stock paths, the call option payoff diagram at expiry (max(S-K, 0)), and the probability cone expanding over time. Shows how volatility sigma affects option price and presents the full Black-Scholes formula.